


Headlines, Rates, and the Farm Equipment Cycle
By Jeremy Bess and Patrick Luce, economists and keynote speakers at Stantec Consulting Services. They are presenters of the Economic Outlook at FEMA’s 2026 Marketing & Distribution Convention.
The headlines say 5% interest rates. The story is two years out.
In September, the 10-year Treasury yield pushed past 5%, and it made headlines from Wall Street to the farm press. Headlines tell you what happened, but it can be hard to understand the real impact to an industry or even your own company performance.
Our view is simple: a macro headline matters when you know how it connects to your market and on what timeline. Interest rates are a good example. Their effect on farm equipment is meaningful, but it tends to make an impact well after the headlines were printed.
That timing gap is the opportunity to plan. If, for example, an economic signal gives you a useful directional read roughly 24 months ahead, you have time to plan inventory, staffing, pricing, and capital spending before the market turns.
Watch the speedometer, not the odometer
Most reporting focuses on levels: the yield is 5%, shipments were this many units, revenue was this many dollars. Levels tell you where you are. That’s the odometer. Momentum, the speedometer, tells you how quickly conditions are changing and whether the cycle is accelerating or slowing.
We focus on momentum, measured as an annual year-over-year growth rate. We take the most recent 12 months, average them, and compare that to the 12 months before. Averaging a full year smooths out planting season, harvest, and lumpy quarterly shipments, so what remains is the underlying trend.
The same idea works for interest rates. When the 10-year yield averaged about 1.4% in 2021 and climbed above 3.9% one year later, the level rose by a little over two points. The momentum, though, was enormous: at its peak, the annual average yield was more than double the year before. That rate of growth is what businesses and buyers feel.
We compared the momentum of the 10-year Treasury yield with the momentum of U.S. farm machinery production going back to the 1970s. Lining these two series up month for month doesn’t quite tell the story. Shift rates forward 24 months and the relationship is at its strongest. There’s one more bit of chart wizardry: the interest-rate line is flipped upside down to reflect the inverse relationship between higher borrowing costs and lower production.
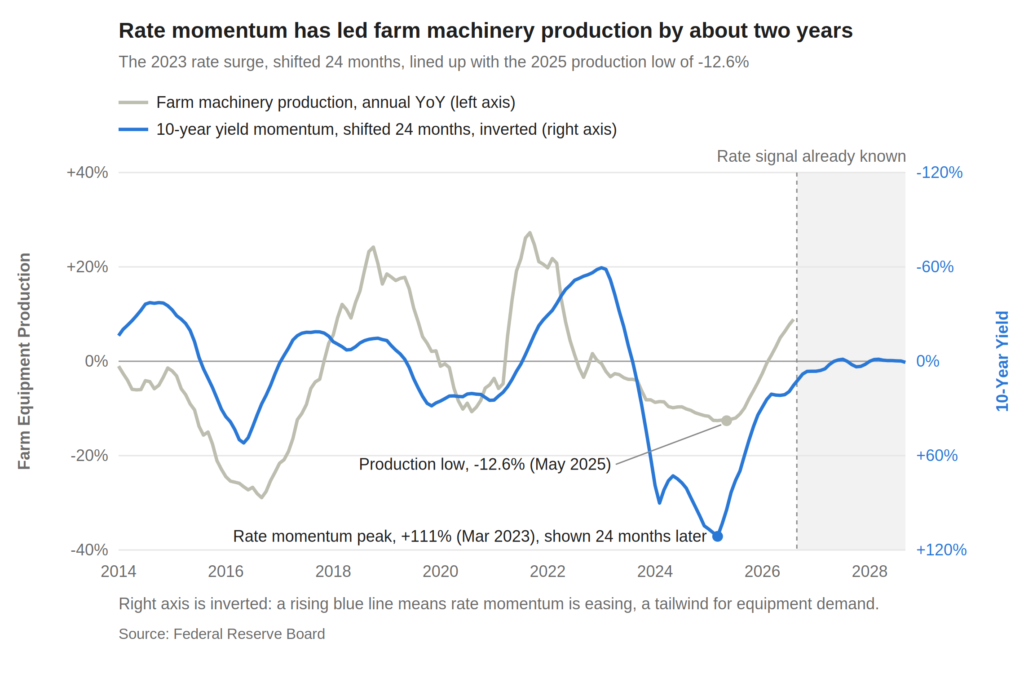
The most recent cycle makes the point clearer. Rate momentum peaked in March 2023, when the annual average 10-year yield was running 111% above a year earlier. Roughly two years later, in May 2025, farm machinery production bottomed out about 12.6% below the prior year.
Why the delay? Equipment is a big-ticket, often financed purchase that competes with land, inputs, and debt service for every dollar of farm income. Higher rates raise borrowing and dealer costs quickly, but buyers stretch the life of what they own, backlogs work down, and dealers trim inventory first. The full effect reaches the factory floor about two years later.
Rates are not the only driver. Commodity prices, farm income, trade, and weather matter too, which is why the fit is far from perfect. Still, when rate momentum moves sharply, as it did in 2023, the industry feels it.
From the headline to the income statement
The industry numbers are useful, but executives might care more about internal measures such as revenue. So we built a simple test. We added up the quarterly revenue of four publicly traded equipment manufacturers serving agriculture and related markets, then compared that combined total to national farm machinery production. The goal was to see whether the broader industry cycle could provide context for how company revenue tends to move.
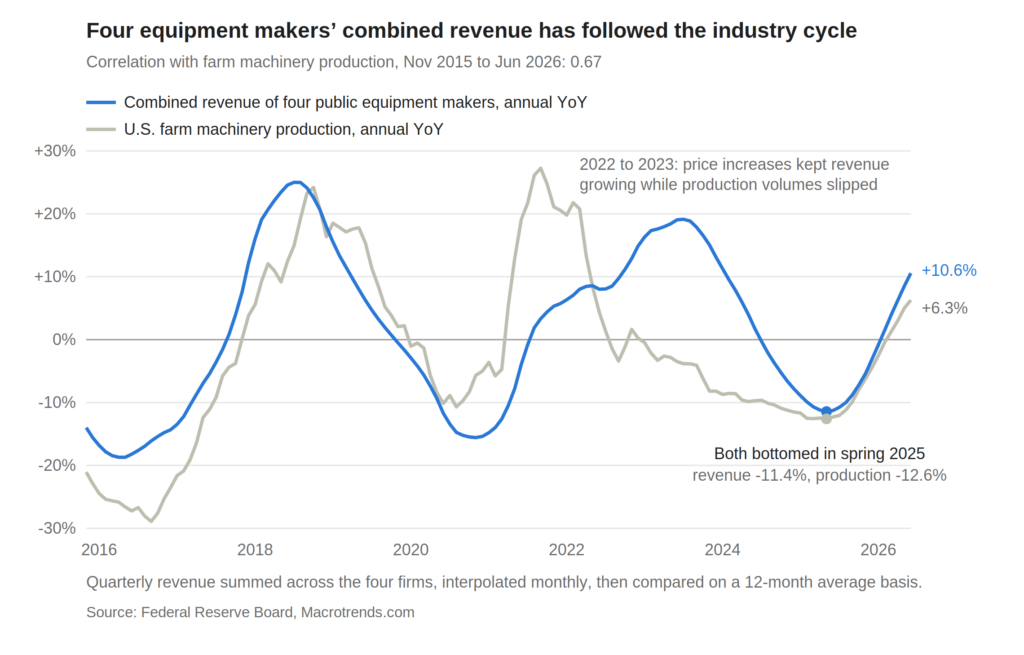
The two lines generally move together despite a group of companies with different products, customers, and regions. Both bottomed in spring 2025, and both turned positive in early 2026.
They do not move in lockstep. In 2022 and 2023, combined revenue kept climbing while production slipped, as price increases lifted dollar sales even as units fell. That is a lesson in itself: inflation can hide a volume slowdown on the income statement. But the turning points line up, and turning points are what planning is built on.
The takeaway is that macro forces show up in individual results. If rates move the industry, and the industry impacts an individual company’s revenue, then a rate headline today is an early read on revenue two years from now.
Stay tuned to next week’s Shortliner for Part 2 of this article, What the Rate Signal Says About 2027 and 2028.

Jeremy Bess and Patrick Luce, Stantec Consulting Services